
Important note: This article is written for defensive security work, authorized bug bounty research, internal audits, and legitimate testing only. I am not sharing exploit payloads or harmful instructions. The focus here is methodology, analysis, and safe validation.

Why huge JavaScript bundles matter more than most people think
The first time I seriously looked at a giant JavaScript bundle, I approached it the wrong way. I opened it, pretty-printed it, started scrolling, and convinced myself that if I just kept reading I would eventually find something important.
I wasted a lot of time.
That was the moment I understood the real lesson: when you are dealing with a large bundle, your job is not to read everything. Your job is to extract value from it.
Modern web applications often hide a surprising amount of useful information inside client-side assets. Not just visible routes and harmless UI code, but GraphQL operation names, internal API paths, request wrappers, feature flags, validation logic, object shapes, and sometimes old or forgotten functionality that never appears in normal navigation.
That is why I do not treat a JavaScript bundle like a wall of code anymore. I treat it like a source of intelligence.
The goal is not to read code. The goal is to build a map.
When I analyze a bundle, I am not trying to understand every function. That is a trap. The goal is to convert a noisy frontend asset into something useful and structured:
- What API endpoints exist
- What GraphQL operations are present
- How requests are built
- What authentication patterns appear
- Which paths are actually worth testing
That is the difference between random scrolling and real reconnaissance.
The UI only shows what the application uses in front of you. The bundle often shows what the application is capable of using.
The mistake most beginners make
The beginner workflow usually looks like this:
Open bundle

Pretty print

Scroll forever

Search a few random words

Get overwhelmed

Quit
I have done that myself. It feels like work, but most of the time it produces almost nothing.
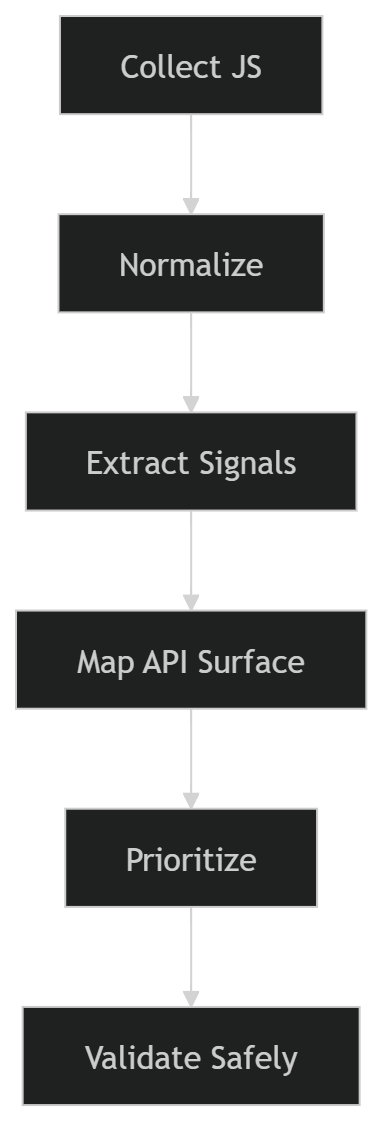
The better workflow is much more disciplined:
Once I started following that structure, bundle analysis stopped feeling messy and started producing real results.
My actual workflow
Step 1: Collect all JavaScript assets, not just the main file
This is one of the easiest places to mess up.
Many people grab main.js or the biggest bundle they can find and assume that is enough. It usually is not. Modern applications split code aggressively. Settings pages, billing modules, admin panels, export tools, integrations, onboarding flows, and secondary account features are often loaded only when you visit the right screen.
So I do not collect just one file. I try to collect everything the application actually loads during real usage.
My normal routine is simple:
- Open DevTools or a proxy
- Enable log preservation
- Navigate the app properly
- Open rare screens, not just the homepage
- Save the JS assets or export the session
I always make a point to explore screens like:
- profile
- settings
- billing
- integrations
- notifications
- admin or management areas
- exports and reports
Some of the most interesting chunks never load unless you trigger very specific parts of the UI.
Step 2: Normalize the files before doing anything serious
I do not beautify code because I enjoy reading it. I do it because it reduces friction.
Minified files are terrible for search, terrible for diffing, and terrible for quick pattern recognition. A basic formatting pass makes it much easier to spot request wrappers, strings, operation names, and repeated structures.
A simple example:
npx js-beautify app.bundle.js > app.bundle.pretty.jsThat alone will not magically reveal hidden functionality, but it makes the rest of the process much faster.
At this stage I usually organize my workspace like this:
work/
  01-js-raw/
  02-js-pretty/
  03-sourcemaps/
  04-extracts/
  05-notes/
That structure sounds boring, but it saves time later, especially when I want to revisit the target or write a clean report.
Step 3: Search for signals, not for vulnerabilities
This is where the workflow starts paying off.
I do not search for “bugs” directly in JavaScript. I search for signals that reveal surface area.
The exact strings vary by target, but I usually begin with a focused set of terms:
On the command line, I like using fast recursive search:
rg -n --hidden -S "(/api/|/admin/|internal|graphql|mutation|sourceMappingURL)" 01-js-raw/
Inside the browser, global search is also useful for fast first-pass reconnaissance. I can often tell within minutes whether a target is likely to be worth deeper review.
At this point I am looking for four things:
- Endpoints such as
/api/, versioned routes, admin paths, internal paths, or full URLs - GraphQL operations such as named queries, mutations, manifests, or operation names
- Authentication clues like bearer headers, cookie usage, tokens, session wrappers, or request interceptors
- Request builders that reveal how the application consistently communicates with the backend
This is also where experience makes a difference. Over time, you stop reacting to every interesting string and start filtering for what is likely to matter.
Step 4: Find the HTTP wrapper as early as possible
If there is one thing that consistently unlocks a target faster, it is finding the central request wrapper.
Serious applications rarely build requests in a totally random way every time. Most of them centralize behavior somewhere. It may be a fetch wrapper, an Axios instance, a GraphQL client, or an abstraction layer with helpers and middleware.
Once I find that layer, the application becomes much easier to understand.
A simplified example would look something like this:
function request(path, options) {
  return fetch(BASE_URL + path, {
    method: options.method || "GET",
    headers: {
      Authorization: token,
      "Content-Type": "application/json"
    },
    body: options.body ? JSON.stringify(options.body) : undefined
  });
}
From one place, I may learn:
- the base URL
- default headers
- auth behavior
- serialization style
- error handling patterns
- sometimes even environment switching logic
This is why I tell people not to obsess over random component code too early. The wrapper often gives more value than fifty unrelated functions.
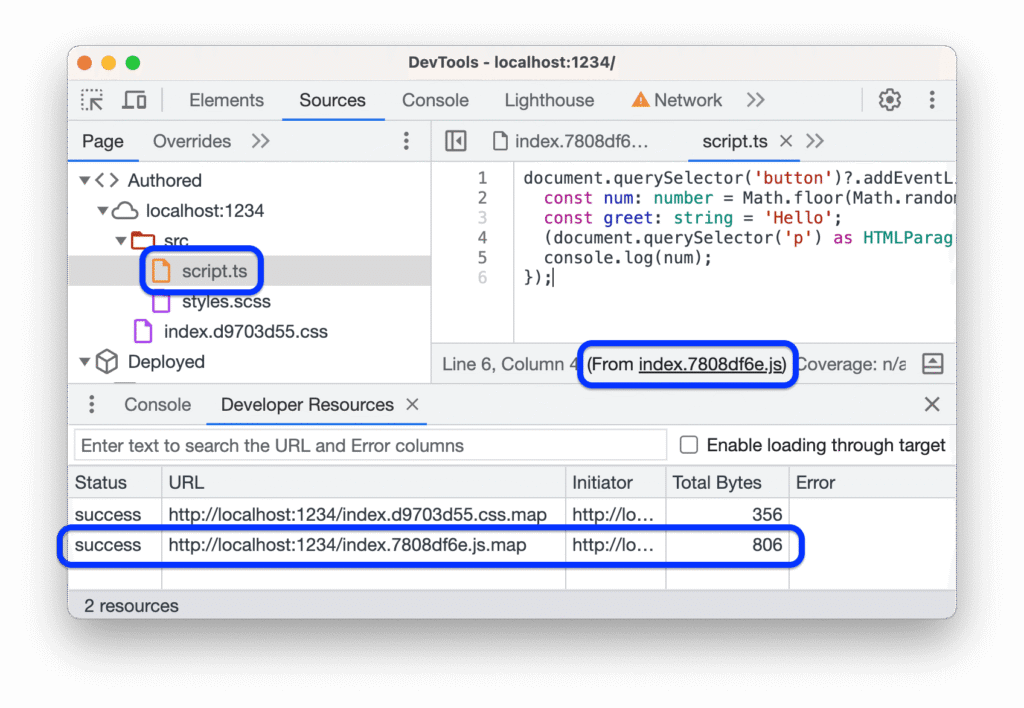
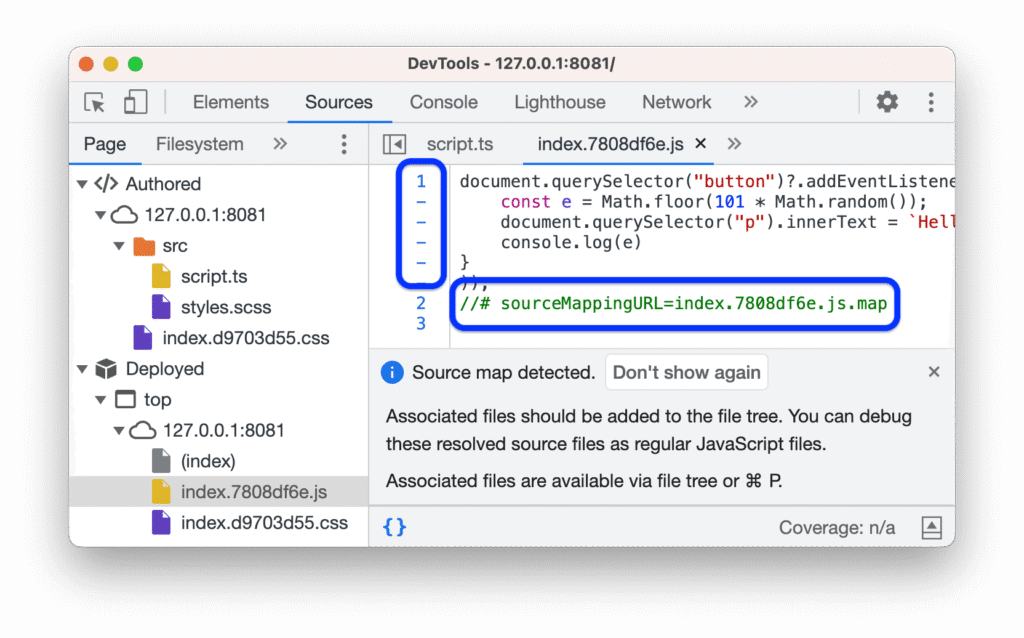
Step 5: Check for sourcemaps before burning time on ugly code
This is another lesson I learned the hard way.
I once spent a long time fighting through unpleasant minified code only to realize later that the sourcemap was available all along. Since then, I always check for sourcemaps early.
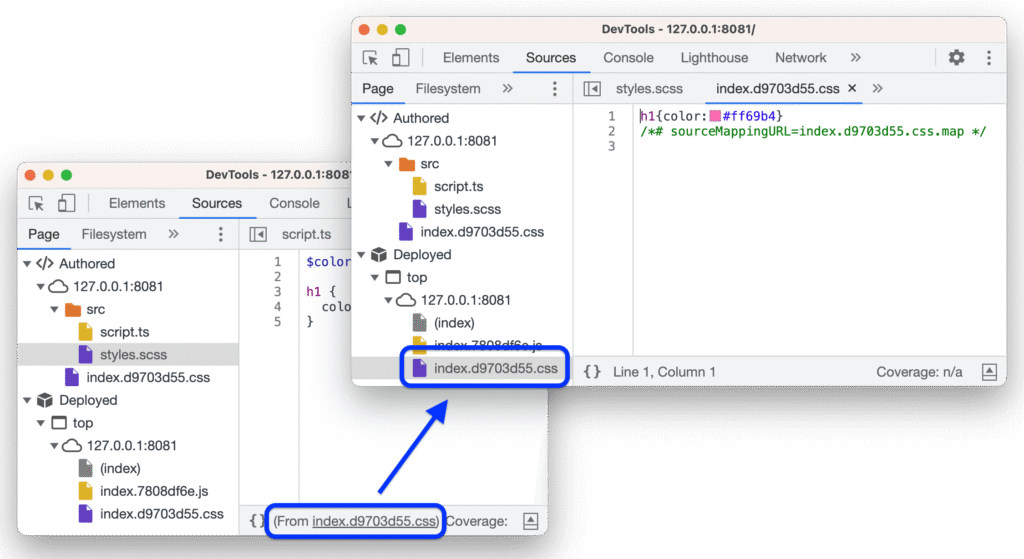
If they are present and legitimately accessible in scope, they can speed up analysis dramatically. Function names become clearer. File structure becomes more readable. Sometimes original source content is present too.
I do not treat sourcemaps as an automatic finding by themselves. Their value depends on what they expose. Sometimes it is minor. Sometimes it reveals far more than the application intended.
What I care about is whether the sourcemap helps me recover:
- original module names
- internal file layout
- request logic
- hidden routes
- sensitive config
That is where the real value is.
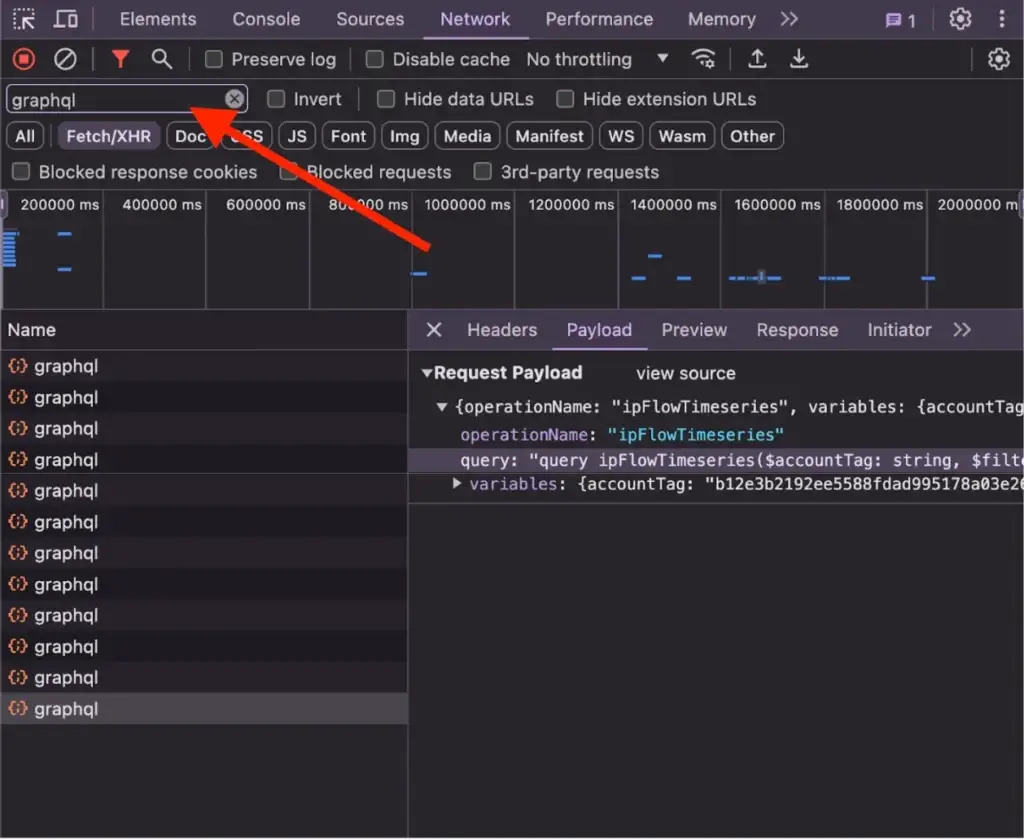
Step 6: Map GraphQL separately
GraphQL deserves its own workflow because the signal looks different from REST.
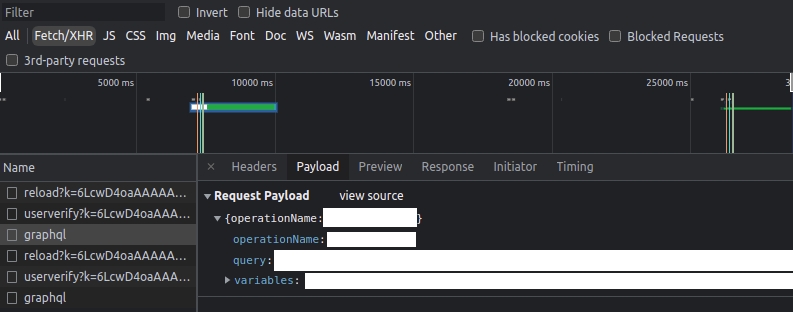
In some targets, operation names are right there in plain text. In others, the application uses persisted queries, hashes, manifests, or wrappers that hide the raw operation during normal network traffic.
That is exactly why bundle analysis matters.
I search for things like:
query GetUserProfile
mutation UpdateOrganization
operationName
persistedQuery
sha256Hash
Even when the live request only sends a short manifest or hash, the bundle may still expose the useful names, variables, or surrounding logic.
I also separate GraphQL operations into two mental buckets:
- queries which usually read data
- mutations which change data and often deserve more attention
Mutations usually get higher priority because they touch state. They are more likely to matter from a security perspective.
Step 7: Build a simple API map by hand
This part is not glamorous, but it is where the work becomes real.
I try to turn all the extracted signals into a small map I can reason about quickly. It does not need to be fancy. A text file, spreadsheet, or note is enough.
A basic example:
Operation / Function      Endpoint / Path        Method    Auth      Objects
-----------------------------------------------------------------------------
GetInvoices               /api/billing           GET       Cookie    accountId
UpdateProfile             /graphql               POST      Bearer    userId
ExportReport              /api/export/report     POST      Cookie    reportId
ManageRole                /api/admin/roles       POST      Bearer    roleId
The point is not to create beautiful documentation. The point is to stop thinking in fragments.
Once I can see the surface in one place, prioritization gets much easier.
What I prioritize and what I ignore
Not every discovered path deserves your time.
One of the most important improvements in my workflow was learning to ignore noise aggressively.
I usually pay more attention to:
- admin paths
- permission and role management
- billing and payment flows
- exports and reporting
- integrations
- object-based paths that accept IDs
- mutations that change state
I usually care much less about:
- analytics endpoints
- tracking scripts
- CDN noise
- generic vendor code
- old dead paths that no longer resolve
This matters because bundle analysis can easily generate a lot of false excitement. You may find a path named /internal/admin/something and think you found gold, but sometimes it is a dead feature, an old experiment, or a harmless front-end artifact.
I learned that the hard way too.
I once found what looked like a valuable internal route in a target bundle and spent time building theories around it. It turned out to be a stale frontend reference to code that was no longer alive. Since then, I validate existence carefully before investing energy.
How I validate safely
Validation should be careful, minimal, and controlled.
If I reach the testing stage, I keep a few rules in mind:
- use test accounts when allowed
- keep request volume low
- change one variable at a time
- document baseline behavior first
- do not turn curiosity into noisy automation
The usual pattern is simple:
1. Replay the baseline request
2. Confirm expected response
3. Change one field or parameter
4. Compare carefully
5. Stop if the path looks dead or irrelevant
This is not just about staying safe. It also produces better evidence. Clean, controlled changes are easier to explain in a report than chaotic experimentation.
Why this workflow works better than raw reading
The reason this method works is that it matches how large applications are actually built.
Modern frontends are not small handcrafted files. They are compiled systems full of abstractions, dead paths, feature flags, wrappers, manifests, and lazy chunks. If you try to read them linearly, you lose time. If you treat them like a dataset and extract the right signals, you move much faster.
That shift changed my results more than any single tool did.
The biggest win was not learning a clever regex or installing a new extension. It was changing the mindset from:
I need to understand all this code
to:
I need to identify what matters and ignore the rest
Practical checklist I actually use
When I want to stay disciplined, this is the checklist I follow:
Confirm scope and authorizationCollect all loaded JS assetsVisit rare or secondary screensBeautify and organize files
Search for endpoints, GraphQL, auth, and wrappers
Check for sourcemaps
Identify the request abstraction layer
Build a small API map
Prioritize high-value paths
Validate carefully with minimal requests
Save notes, screenshots, and evidence
Final thought
Huge JavaScript bundles look intimidating at first, but most of the fear comes from approaching them the wrong way.
You do not need to read everything. You do not need to understand every function. You do not need to spend hours drowning in minified noise.
You need a process.
Once you have one, those massive bundles stop looking like chaos and start looking like what they really are: a compressed map of the application’s client-side behavior, hidden surface, and backend relationships.
That is where the value is.
And in my experience, the people who consistently find the most useful things are rarely the ones scrolling the longest. They are the ones extracting the right signals first.
